
Find the session blocking a PostgreSQL query
Follow a waiting query to the transaction holding its lock. At the end, you should have the waiting PID, the blocking PID, the application and the age of the blocking transaction — enough context to discuss the incident with its owner.
Before you start
Install Recern Workspace, add a PostgreSQL connection and keep Safe Mode on for production. Your database role needs visibility into the sessions you want to inspect. An administrator can provide an appropriate monitoring role; a restricted account may not see another user's query text.
This walkthrough reads activity and lock statistics. It does not require changing application data or terminating a session.
1. Find the waiting session
Open the connection and choose Sessions. The Blocked count is a useful starting point. Select Lock chains to keep both waiting sessions and their blockers in view.
Look at PID, Application, Waiting on, Transaction and Query text. A long-running transaction and a long-running query are different clues: a connection that is idle in transaction can still hold a lock after its last statement has finished.
2. Follow the wait chain
Open Locks and read Wait chains. The root is marked blocking; the indented entries are sessions waiting behind it. Follow the chain to the root rather than assuming that the slowest visible query is the cause.
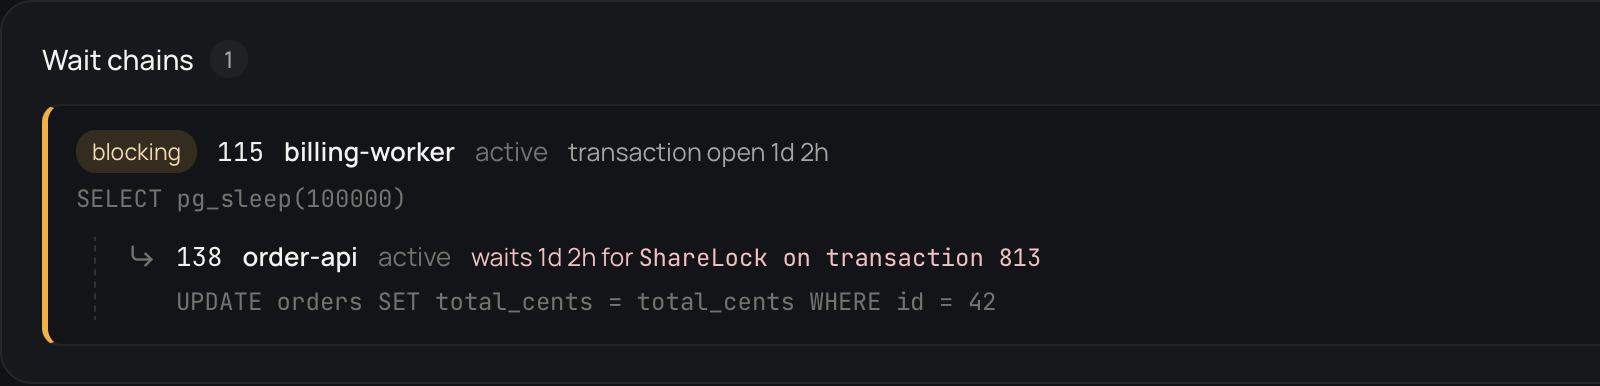
Native Workspace capture with synthetic fintech data. The PIDs, statement text and timings illustrate this demo, not your database.
In All locks, choose Waiting to focus on locks that have not been granted. Click a row to read its query. Use Transaction ID locks when those locks are relevant; they are hidden by default to keep the list readable.
3. Cross-check with a read-only query
If you need a compact list to share with the database owner, the Console can run this read-only query:
SELECT pid,
       application_name,
       state,
       wait_event_type,
       wait_event,
       clock_timestamp() - xact_start AS transaction_age,
       pg_blocking_pids(pid) AS blocking_pids,
       query
FROM pg_stat_activity
WHERE datname = current_database()
  AND cardinality(pg_blocking_pids(pid)) > 0
ORDER BY xact_start NULLS LAST
LIMIT 50;
blocking_pids identifies the sessions to investigate next. If no rows appear, there may be no current lock wait, the wait may have ended between refreshes, or your role may not have enough visibility. A slow query can also be waiting on I/O or another resource rather than a database lock.
4. Confirm the result
Record the waiting PID, root blocker PID, application and transaction age. Let the owner decide whether the transaction should finish, commit or roll back. Keep incident remediation separate from this read-only investigation.
After the owner resolves the blocker, refresh Sessions and Locks. The waiting session should leave the chain when its lock is granted or its query ends. If it remains blocked, follow the new chain; the blocker may have changed.
Continue with Safe Mode and the console or query history and export.
Reference: PostgreSQL documents session activity and visibility and pg_blocking_pids.